While I try to figure out the frequency of the main newsletter, I decided to share some findings from the first failed project on this journey. Hoping the data, insights, and learnings can spark some engaging conversations.
About this project
Target audience:
Remote based product development teams at high growth SaaS companiesProblem to solve:
Building a deep and shared understanding of customer problems and why they need to be solvedWhen the issue occurs:
When a new project or data about a project is introduced to a teamWhy it is a problem:
If a team is not aligned on the context of a problem, it often leads to misalignment about the solution, leading to the wrong software being developed.
This post has been broken into three key sections:
Background
Research approach and findings
Problem & solution shaping
Finally, my ask to you, the reader, will be to consider/share other ways you believe this could have been approached or solved.
1. Background
‘Oh f*ck!’ - An origin story
(You can jump to the next section if you only want to see the data)
It was a day like any other, we were four weeks into a complex development cycle, and the team presented their daily update. However, today, I noticed an engineer had started explicitly calling out one specific platform that this feature was to work with. The words hadn’t finished falling from their mouth when this horrible sinking feeling in the pit of my stomach started to form.
This solution was to work with five platforms, not one! Fighting the instinctual urge to bury my head in the sand; I then asked the question, “this is designed to work with all five key platforms though, right? not just the one you are talking about?”
To make a short story long….
I had just made at least a $115,000 mistake (a very crude estimate).
My responsibility as a Product Manager is to empower teams to solve complex problems by providing them with the appropriate context. Unfortunately, despite doing it all by the book (one-pagers, collaborative design sessions, epic creation), the team had missed the part that outlined it needed to work with five platforms, not one. This was not the team’s fault; it was mine. I failed to provide the context in a medium that they understood, and I did not stop to test if we had a truly shared understanding.
At that moment, I said we can’t keep living in a world where such a big mistake can occur.
Validating if there was a market.
I found a gap in the market, but the next step was to validate if there was a market in the gap. Below are some stats that ultimately gave me the green light to continue with discovery.
Trends
Product Management roles have grown by over 32% in the last 3 years.
Product Managers spend over 41% of their time working with teams on specifying problems to solve.
Revenue from Software development is expected to grow at a pace of 7.2% in the next 4 years.
The productivity software tools market is currently $41.90 Billion in 2020 and is projected to reach USD 122.70 Billion by 2028, growing at a CAGR of 14.49% from 2021 to 2028.
Change event/inflection points
Pandemic accelerating the move to remote working.
Remote working was already said to increase by 100% in the next 4 years based on pre C19 numbers.
Value
IBM found that the cost to fix an error found after product release was 4 to 5 times higher than if it’s uncovered during the design phase and up to 100 times more expensive than if it’s identified during the maintenance phase.
The path to answers
Below is a rough overview of the process I followed to assess how big or small of an opportunity there was.
Step 1 - Trying to verbalise the problem to other product friends.
Step 2 - Form a research question and question set.
Step 3 - Conduct user interviews.
Step 4 - Map out themes from the interviews.
Step 5 - Validate the themes are representative of the market using quantitative methods such as surveys.
Step 6 - Analyse findings.
Step 7 - Ideate/prototype.
Step 8 - Build.
Step 9 - Conclude.
2. Research approach and findings
Research question
Below are the initial research questions that formed after conversations with peers.
Qualitative findings from user interviews
About the interviews conducted
40 potential candidates identified
24 interviews conducted
Sourced from - Twitter (8), LinkedIn (3), Slack groups (5), Friends (4), Colleagues (3), Product Tank (1)
Below are the key highlights we found from these interviews.
A jobs to be done map was created to understand where had the most friction in the process. This map lists the key steps the user goes through to complete a job and the desired outcomes of those steps.
All of the above can be seen in more detail here.
Quantitative findings from surveys
After extracting the themes above, a survey was conducted to understand the areas of the highest importance that also have the lowest satisfaction with existing solutions.
Survey details
Sample size - 55*
80% of respondents were fully remote
86% of respondents worked in Product Management
People who responded came from the following organization size
1 - 49 = 60%
50 - 499 = 20%
500 - 4,999 = 7%
5,000+ = 13%
*A sample size of 55 is too low to be significant but I made a call to use it as a directional guide as the cost/benefit of trying to reach significance did not add up.
The output of that research was summarised in the form of opportunity scores.
To get an Opportunity score, you get users to rate the importance and satisfaction of desired outcomes on a 1-5 scale. Then you use the formula below to get that score.
Importance + (Importance-Satisfaction) = Opportunity
To evaluate the results, follow these guidelines:
Opportunity scores greater than 15 represent extreme areas of opportunity that should not be ignored.
Opportunity scores between 12 and 15 are “low-hanging fruits” ripe for improvement.
Opportunity scores between 10 and 12 are worthy of consideration, especially when discovered in a broad market.
Opportunity scores below 10 are viewed as unattractive in most markets, offering diminishing returns.
Below is the table which shows the areas that showed the highest potential.
3. Problem & solution shaping
With the job to be done established and a good signal that there was an opportunity worth exploring, we began going deeper into the user workflows. The objective here was to understand where the process breaks down. Below are all the artefacts from this process.
Refined Jobs to be done definition
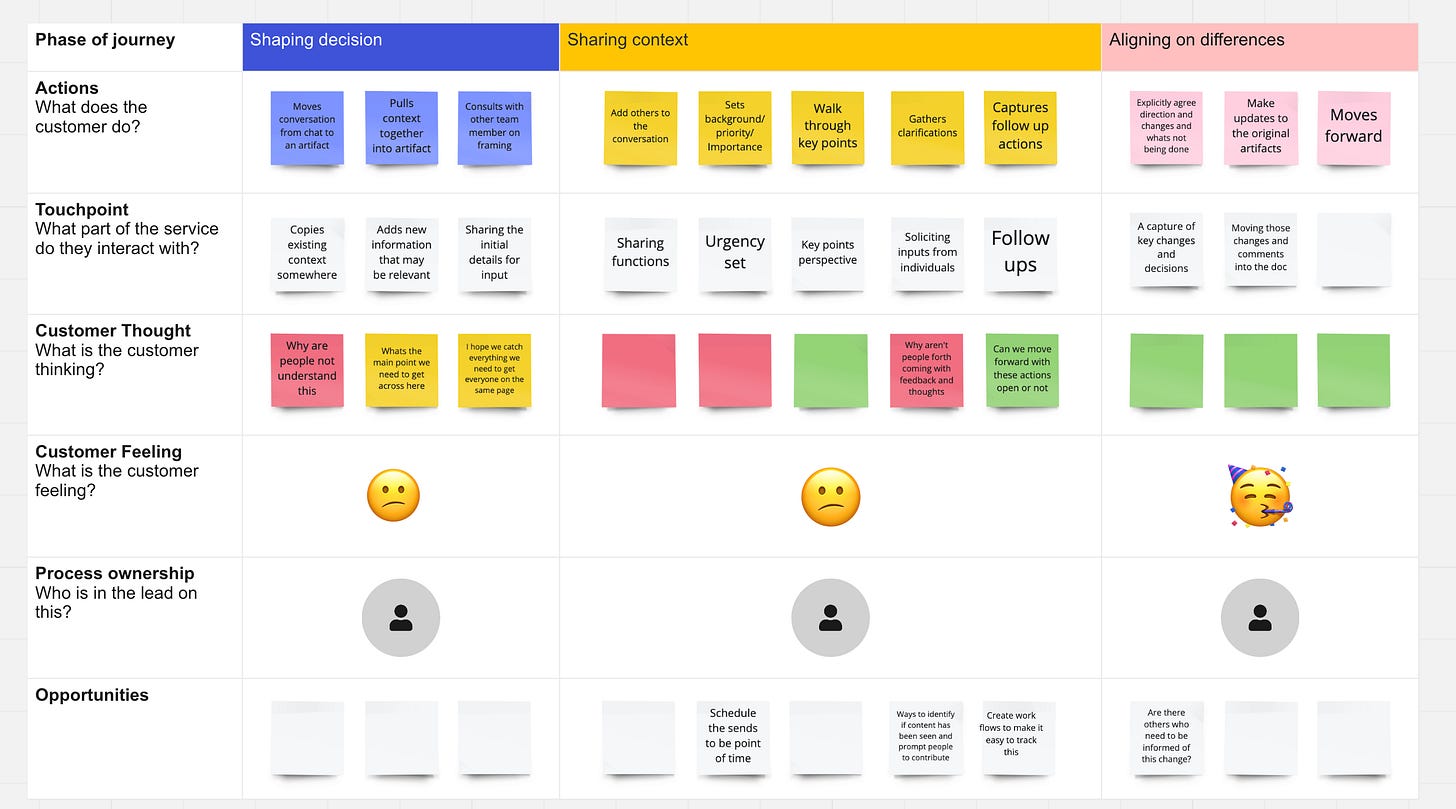
Journey maps
User journey when misalignment occurs
Detailed maps can be viewed below:
Solution shaping
During the user deep dives, a key observation was that PMs/Designers desire some form of a feedback loop to know that people understand what they are sharing. Their current indicator for understanding a complex topic was based on how much the team engaged with it.
With this, the following hypothesis was formed:
We believe that if you ask team members to explicitly state how confident they feel about the direction/decisions being proposed, it will lead to deeper engagement and understanding of a topic due to informally documented accountability.
The measure of success in reducing the number of times a topic has to be revisited during development.
Prototypes
Below is a screenshot from one of the many many prototypes developed to form and validate this hypothesis.
You can also check out a crappy clickable prototype that shows the workflow of how you could create an alignment log for a topic.
No-code versions
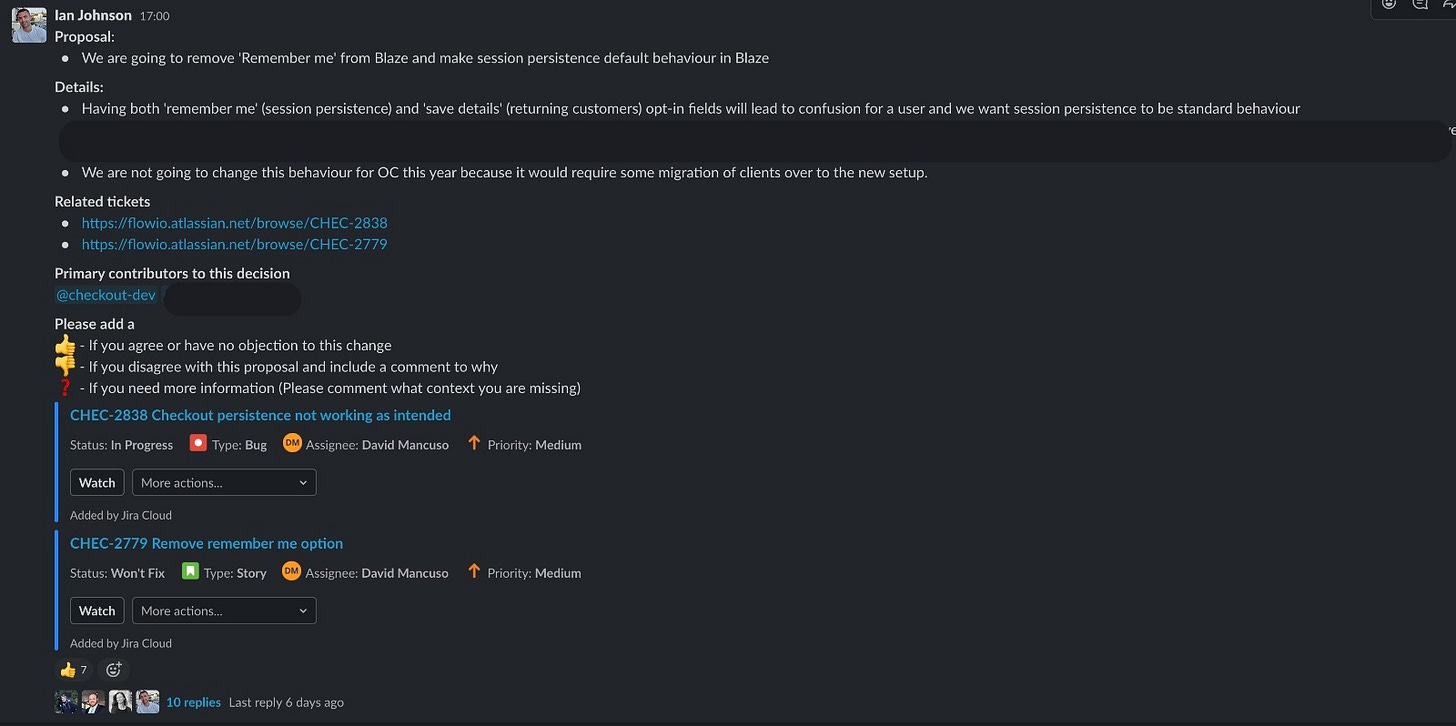
The first version was to create a custom message in Slack to see if it increased engagement from team members. This particular example was fully async.
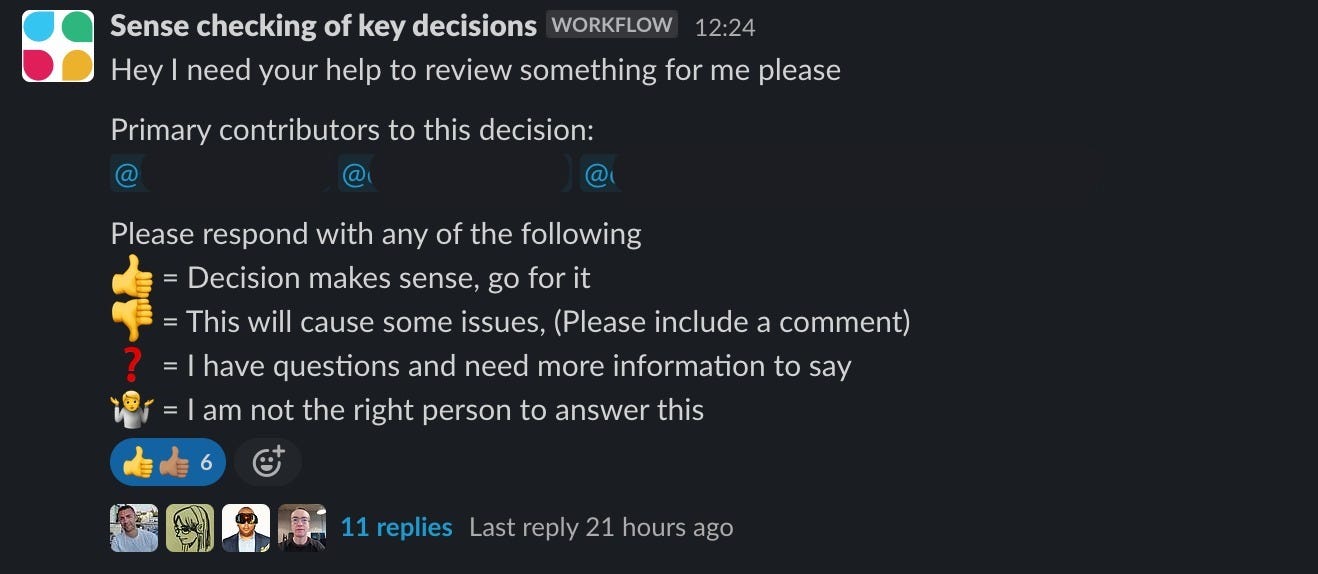
The next version was to automate the team callout format to also be used while on Zoom calls. It went to Slack, but it still got the job done with some guidance.
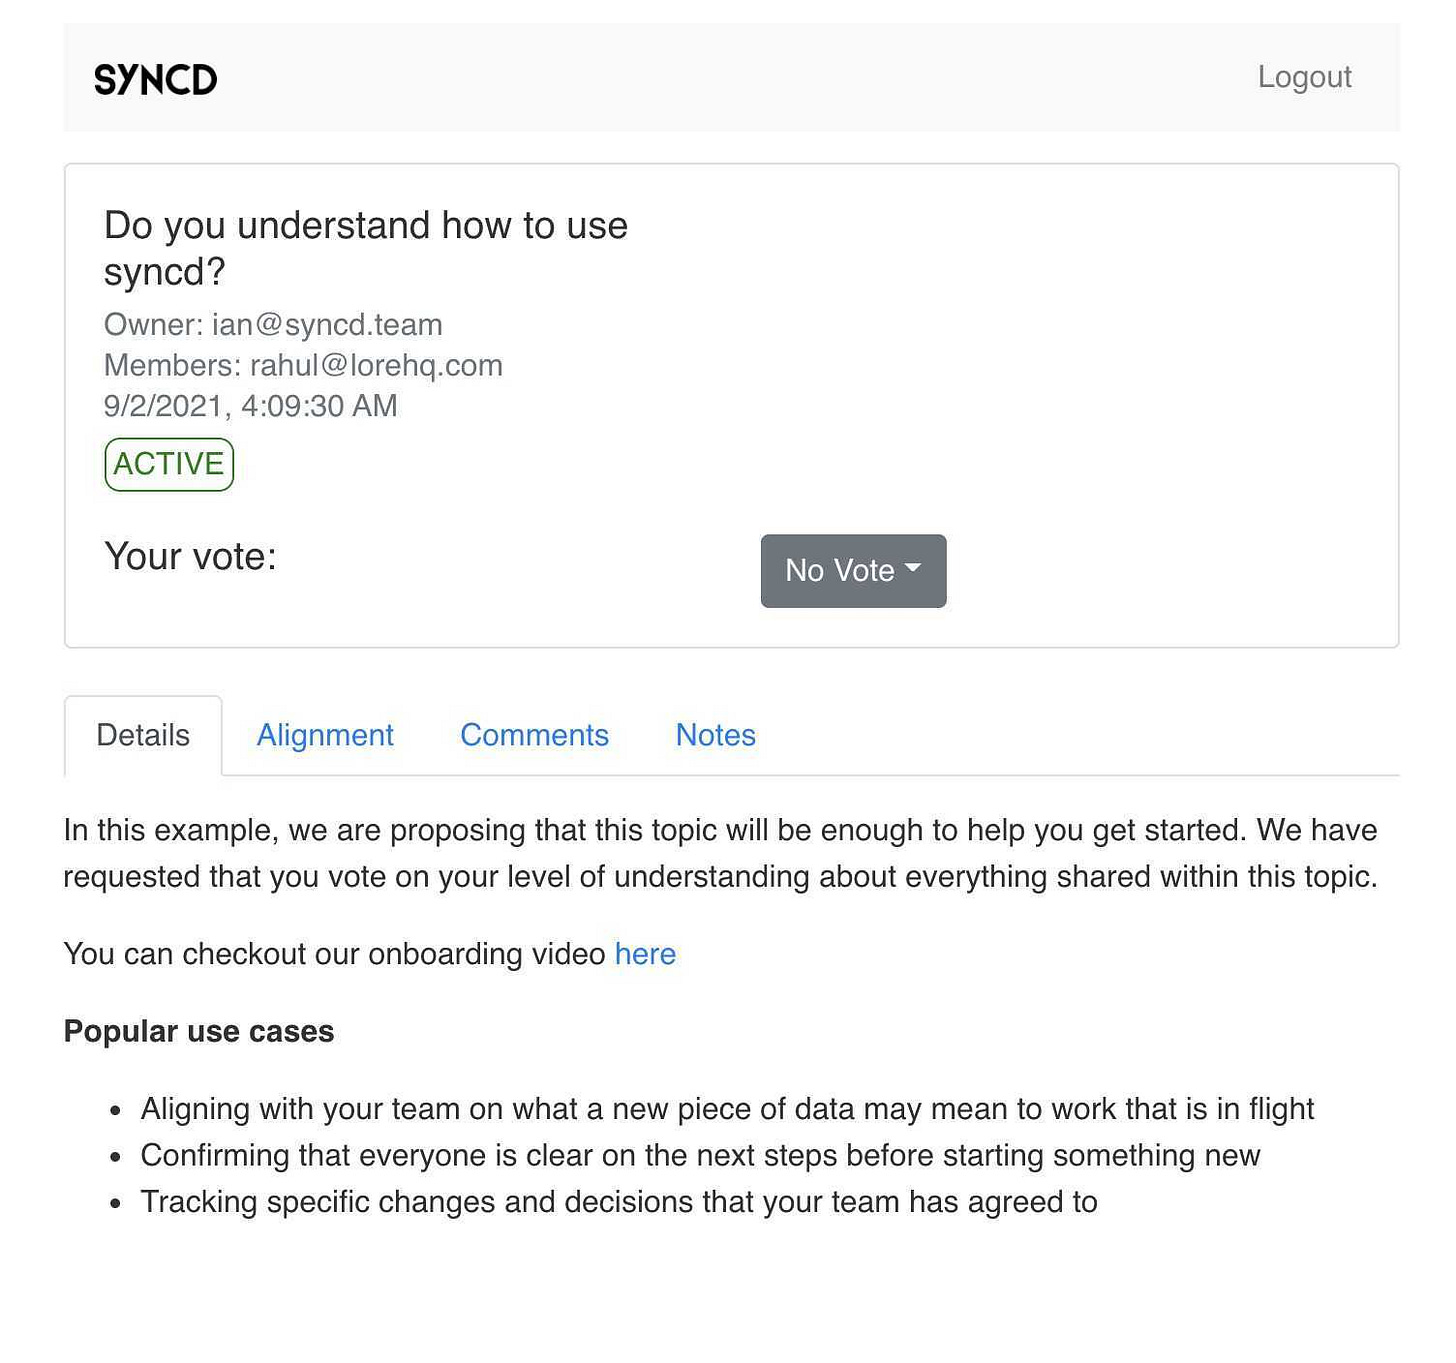
Then below is a screenshot of the web app we built during the 4-week YC build sprint.
We had about 40 companies signed up for the web app, but adoption plateaued quickly after onboarding. So after reviewing the week-on-week stats, customer feedback, and taking advice from some of our mentors, we decided to pull the plug on this idea.
Final learnings
People are incredibly hesitant about adopting new tools that require network effects to create value.
Unmeasurable waste mitigation in software development is a hard sell.
If the task is not frequent enough and requires a new behaviour to be formed, people often forget the tool exists. Based on this observation, automation and integrations into existing workflows potentially increase in importance for adoption.
We prioritised building a web app because it meant we could release it sooner than a Slack app; however, it is unclear if it was the right decision given what we knew about the importance of workflows.
Fully asynchronous teams called out that this problem rarely occurs for them because they invested in creating a culture of documentation and deep reading.
European VCs are sceptical of Product Managers building for Product teams vs US VCs who saw it as a positive trait.
There are very few purpose-built tools in the market that have effectively solved shaping problems and building alignment. The two companies that I am rooting for to solve the problem are Dimensions and Fable.
Questions
Did we read the market wrong?
Was there a better approach to discovering a solution than the ones chosen?
Did you spot red flags earlier in the process that would have made you stop sooner?
Shoutouts
Rahul Patni - Rahul and I partnered together to validate this problem. Rahul relentlessly dedicated every second he had to spare for us to go from prototype to MVP.
To every early user and interviewee - your time and thoughtfully considered feedback were what made any of this journey possible. I was blown away by your support and how you went out of your way to bring us into your companies and networks.
Mentors


Hey Ian, love what you share!
Have couple questions:
1. Based on your Satisfaction/Importance table 2 things stand out = find artifacts fast & maintain them. Why you chose to build product about alignment with teams?
2. How have you got 40 companies sign in? Thats impressive
3. Do you think digging into "why" teammates misalign and not ask extra questions would shape your product idea differently?
It's really helpful to see the process you followed in detail. Great write-up!
I'm curious did you research the competitors and other alternative solutions in the market you mentioned in your final learnings before starting this process?